-
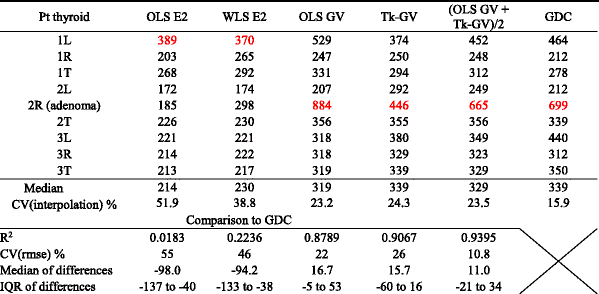
aRegressions used were ordinary least squares (OLS), weighted least squares [WLS; 1/C(t)2 weighting], and an inverse method; Tk-GV. These were applied to biexponential (E2) and gamma variate (GV) functions. The longest MRT value for each method is in red. IQR is interquartile range. How well the total (T) thyroid interpolated the L and R MRT values was calculated as a coefficient of variation of interpolation, CV(interpolation), from the standard deviation of the distances to interpolation, d = MRTTotal − min{MRTL, MRTR}, divided by the mean of their interpolation interval, ii = |MRTL − MRTR|. The CV of the root mean square error CV(rmse) was calculated for method M ≠ MRTGDC as \( {\left\{{\displaystyle \sum_{i=1}^n\frac{{\left[\mathrm{M}\mathrm{R}{\mathrm{T}}_M(i)-\mathrm{M}\mathrm{R}{\mathrm{T}}_{\mathrm{GDC}}(i)\right]}^2}{n}}\right\}}^{\frac{1}{2}}{\left[{\displaystyle \sum_{i=1}^n\frac{\mathrm{MR}{\mathrm{T}}_{\mathrm{GDC}}(i)}{n}}\right]}^{-1} \). The median of differences was taken pair-wise. Note that the errors for OLS GV and Tk-GV appear to be, on average, in opposite directions
